Drawing Salesforce Diagrams using Elements.cloud
At TrailheaDX, Salesforce launched a systems diagramming notation for Architects (Salesforce Diagrams) and a business process mapping notation for Business Analysis (Salesforce UPN). This article explores Salesforce Diagrams and which standard to use when.
“As Architects we know that diagrams are an important tool in our toolset. When we surveyed you, we heard loud and clear that you want more diagramming tools and more standardised diagrams.”
Susannah St-Germain – Architect Evangelist
SALESFORCE DIAGRAMS
Salesforce Diagrams is a set of diagramming design standards for Architects. It is designed for system diagrams including ERDs and a great deal of design thinking has gone into the readability and useability of the diagrams. You can use any number of tools to draw the diagrams to match the standards.
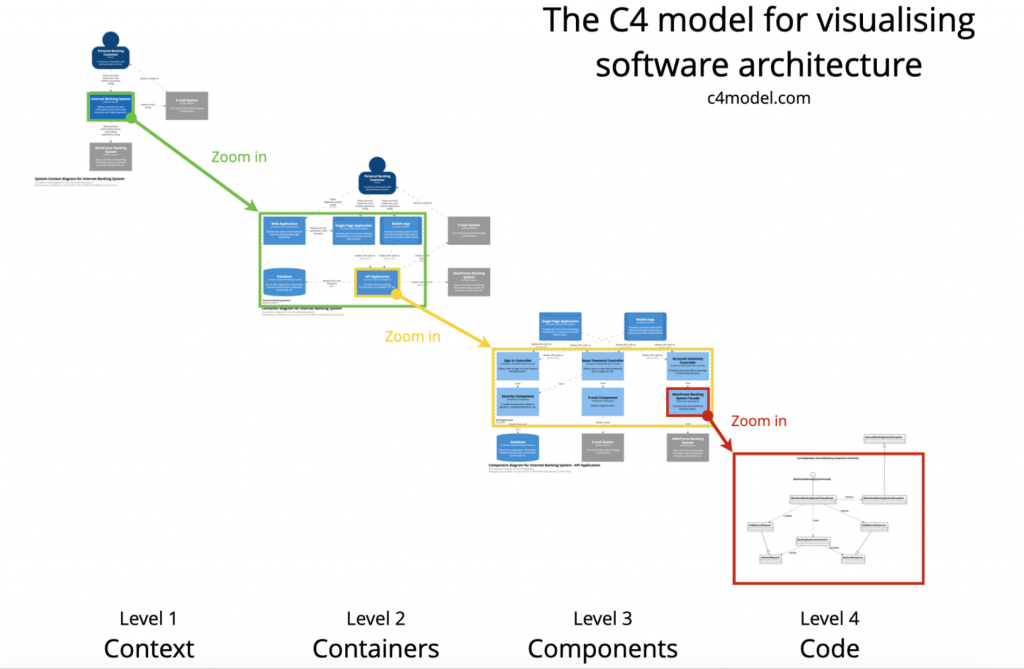
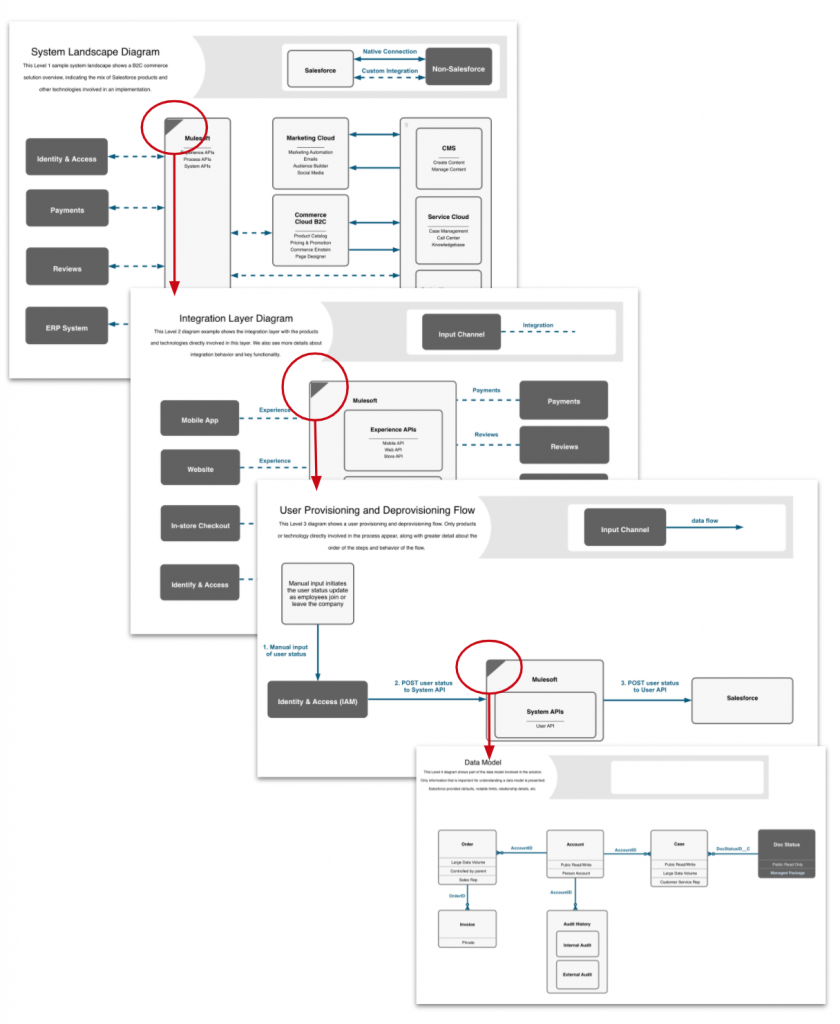
Salesforce Diagrams follows the C4 Model approach, which means that there are 4 different level diagrams.
- Level 1: The big picture. The systems landscape
- Level 2: A piece of the whole. A subset of the landscape
- Level 3: Process or interaction view. A limited view of the technologies in a solution
- Level 4: Double click. The data model showing just the objects involved
The design standards styles can be downloaded as Google and Powerpoint diagrams and in the future, Lucidchart. Do not underestimate the effort in managing these relationships if they are all separate diagrams in these tools. Which is why we have also created an Elements map applying the standards that you can download.
Here is the Salesforce approach to building Salesforce Diagrams https://architect.salesforce.com/design/diagram-templates/how-to-diagram/
3 reasons why Elements is perfect for Salesforce Diagrams (rather than a single level diagramming tool)
- Hierarchies: Elements manages hierarchies of diagrams elegantly. Manage all the diagrams as a map rather than discrete diagrams; access controls, versioning, reporting, linking, collaboration, and branding.
- Linking: You can also link any shape to supporting documentation (notes, screenshots, URLs, diagrams, PDFs), Salesforce metadata, user requirements and user stories.
- Collaboration and versioning: Control edit and view access. Apply versioning and sign off. Viewers can collaborate and provide feedback.
We have developed a process map that shows how Elements supports the Salesforce Diagram standard. You need a free Elements user account. Here is a link to the map.
https://diagram.q9elements.com/diagram/60d76c362947d90009841a9d?parent=HD-APP&v=draft
Using the process map and the styles
You can copy it into your Playground Space. You can then set up a Salesforce Diagram Theme to apply the styles to the map with a changes below. Themes help topic.
Activity box:
- Background color – #F7F7F7
- Border color – #696969
- Border width – 3
- Number hidden – checked
- Font color – #00000
- Font – bold
Resource
- Fount color – #00000
- Apply to all resources
Flowline
- Font color – #00587D
- Font – bold
- Line color – #00587D
- Line width – 3
Text
- Font color – #00000
- Font size – 20px
- Text align – left
- Vertical align – top
All formatting for text, boxes and lines is in the right panel when you have clicked on an object. For example, line styles are changed by clicking on a line and in the right panel look under “Line Format”. You can change to dotted, curved vs straight and also the end errors / ERD crows feet. You can overwrite the standard styles and copy / paste the styles to other objects on any diagram
WHEN TO USE DIAGRAMS VS SALESFORCE UPN (UNIVERSAL PROCESS NOTATION)
Salesforce UPN (Universal Process Notation) is a business process mapping notation for Business Analysts. UPN has been proven over the last 20 years in Salesforce customers of all sizes. It is designed to be easily understood by all the stakeholders involved in any implementation; analysts, end users, architects, developers, management and auditors. This means it needs to be a simple notation, but with the power to capture the nuances of any business process because “the devil is in the detail”. And the diagrams need to be read on-line embedded in applications. Again, you can use any number of tools to draw the process maps to comply with the notation.
The Trailhead team launched the Business Process Mapping for Analysts, How to draw Business Process Maps and updated Business Analysis Best Practices Trailhead badges. There is also an in depth Business Process Mapping for Architects course which is accessed from the Partner Learning Camp.
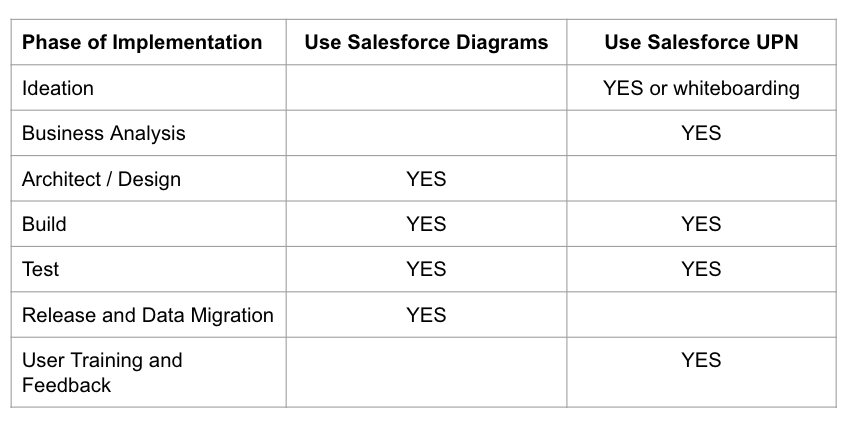
The immediate question is, “Are these competing or complementary standards”. The answer is that they are complementary and there may be a requirement for relationships between diagrams to connect the systems and business process views.
The table below shows which standard to use for each phase of an implementation. Importantly, both types of diagrams are needed if the implementation is going to be successful. And remember, this is critically important documentation which captures the configuration knowledge of the application. So they need to be linked back to the metadata that is changed because it is used for future releases.
In summary
It is fantastic that Salesforce is investing in driving great documentation standards. Whilst not everyone enjoys documenting what we are about to build or what we have built, we all understand the value of walking into a well documented Org.
Sign up for
our newsletter
Subscribe to our newsletter to stay up-to-date with cutting-edge industry insights and timely product updates.


