5 New products announced
[spb_text_block animation=”none” animation_delay=”0″ simplified_controls=”yes” custom_css_percentage=”no” padding_vertical=”0″ padding_horizontal=”0″ margin_vertical=”0″ custom_css=”margin-top: 0px;margin-bottom: 0px;” border_size=”0″ border_styling_global=”default” width=”1/1″ el_position=”first last”]
5 NEW PRODUCTS ANNOUNCED AT #TDX22
[/spb_text_block] [spb_text_block animation=”none” animation_delay=”0″ simplified_controls=”yes” custom_css_percentage=”no” padding_vertical=”0″ padding_horizontal=”0″ margin_vertical=”0″ custom_css=”margin-top: 0px;margin-bottom: 0px;” border_size=”0″ border_styling_global=”default” width=”1/1″ el_position=”first last”]
Salesforce DevOps Center integration
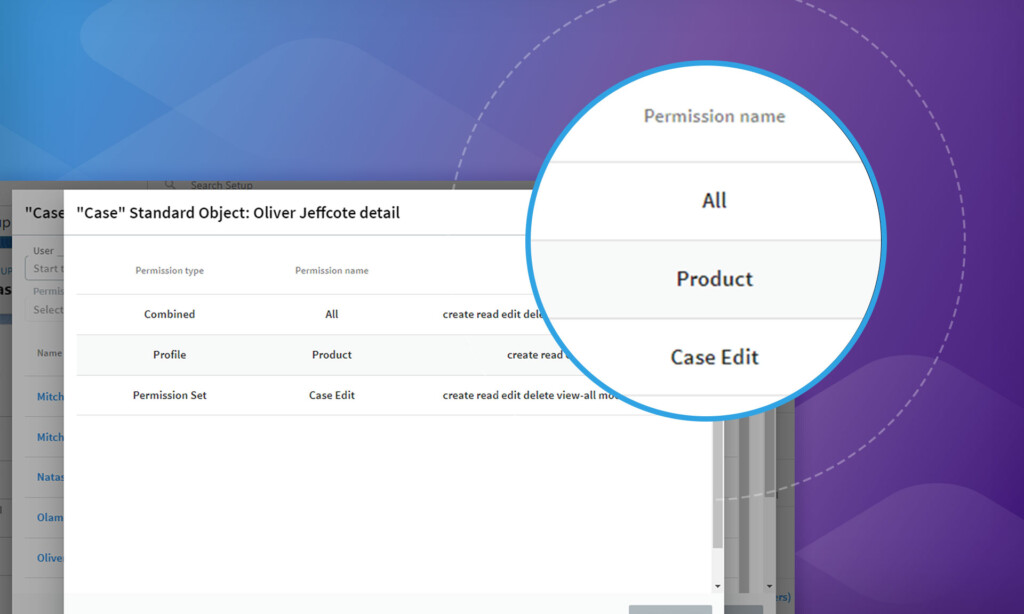
Elements provides the business analysis and org analysis to make sure that the development team can “Build the right thing”. It also provides the critical handover document – the User Story or Work Item – which is the specification of what needs to be built. DevOps is all about “Building the thing right”. It is about streamlining build and deployment so you can increase the speed and frequency of delivery. Elements provides the org metadata impact and dependency analysis in the context of the User Story/Work Item to enable the development teams to understand the risk of making changes, and also allocate the right level of development and test resources. Whilst Elements can work with any DevOps app, Salesforce is launching DevOps Center. This is a free application, is the replacement for change sets and provides source control using Github.
Elements has built a tight integration with DevOps Center which means that together they provide a complete solution for the Software Development Lifecycle (SDLC). DevOps Center is in closed beta, but will move to open beta in the summer and GA in the Fall at which point every customer can kiss goodbye to change sets.
Multi-cloud Dependencies
The Salesforce platform… is not an application island. The Customer360 view means that it is integrated to other applications or clouds in the Salesforce ecosystem – Slack, Mulesoft, Tableau, Pardot – but also other strategic applications – Netsuite, ServiceNow, ZenDesk, Celonis, Workday and many, many, many more!
Therefore, changing your Salesforce Org risks affecting your other systems and corrupting the data flow. And vice versa- innocent tweaks in your other systems may have unforeseen and drastic impact on your Org. But what if you could foresee it?
With Elements, you can now build metadata dictionaries for any 3rd party applications and create links between any metadata in any dictionary. These will all be visualized in the dependency trees so you get the full picture of the impact of making changes.
Let’s say, hypothetically, that stage field on the Opportunity is used in a Tableau dashboard, updates a Slack channel when a picklist value changes, and populates Netsuite via Mulesoft when the stage is moved to closed. Being able to see this when assessing impact dramatically lowers the risk of and increases the confidence to make changes at pace.
Org Complexity/Health
Salesforce Orgs are often big and scary. Tens of thousands of metadata components, all configured to different standards, by different people, and for different purposes. Not to mention, mountains of technical debt. Consultants and admins are expected to implement working solutions quickly in the environments they do not understand.
That’s why at Elements we are working on providing you with unparalleled insights into the health of your Org. We want to transform Org Discovery into Org revelation. And we will do that with complexity scoring.
We will provide you with breakdowns of your objects and automations by levels of complexity, so you can spot potentially problematic areas. We will help you track how the complexity of your Org changes over time, so you can manage the quality of your Org configuration. And finally, with complexity insights on individual components, we will help you project the cost, effort and testing required to implement any change.
We calculate the complexity from the bottom up – by looking at each metadata item and allocating a complexity score. These scores are then aggregated and rolled up to parent metadata and then to different Org areas, all the way up to an overall Org Complexity score.
This is ultimately about Accelerating Time to Value, and helping you project the cost and effort required to customize your Org.
Org Adoption / Salesforce Event Logs
We talk about “Building the right thing” by more complete and rigorous business analysis before you launch into development. You may have heard the term “Shift Left” which is identifying issues and conflicts through business and org analysis as early as possible – in design rather than in production – as they are 100x cheaper and quicker to fix.
But even with the best analysis are the users using the apps and features as expected. There is one way to know; the Event Logs. This can tell us which users used which page layouts, which automations were fired and when – and a whole lot more
By analyzing these patterns which can provide another critical dimension to the understanding of the org metadata and Org Health. It can identify training needs or potential enhancements that can enable the business to be more responsive and productive.
This is ultimately about Accelerating Time to Value.
Salesforce Architect Diagrams
Salesforce is putting a lot of investment and energy to enable customers to build more reliable and scalable solutions by better upfront architecture design. They are launching an initiative called “Well Architected” and last year then developed some architecture diagram standards called “Salesforce Diagrams”. These are template diagram types such as a System Landscape, Data Flow or ERD. They have also developed some style guides to make the diagrams easy to read and understand.
Whilst you could draw them using a diagramming tool like Powerpoint or Lucidchart, but then they end up as individual diagrams that are siloed. The diagrams are interconnected to each other but also to other assets such as princess diagrams, user stories, requirements and org metadata. When connected they form the critical audit trail of changes and the institutional knowledge of the org.
The power of the Elements UPN modeling app is drill downs, linking, and version control. Think how powerful it would be if the same approach were applied to Salesforce Diagrams.
[/spb_text_block]
Sign up for
our newsletter
Subscribe to our newsletter to stay up-to-date with cutting-edge industry insights and timely product updates.