Business Analysis delivers tangible benefits
Measurable benefits
We often hear: “We haven’t got time for that”. It does take more time to do rigorous business analysis — but not that much more. But you will get back the extra time invested ten-fold due to:
- identifying quick process improvement wins, some which could be implemented without system changes
- eliminating the rework in the build and test phases due to miscommunication around architecture and requirements
- better adoption because you are building the apps users need plus you eliminate training material development if you embed the process diagrams inside Salesforce page layouts or in a portal.
The business will quickly see in the first analysis workshop the power of a well crafted process map. They will then be happy to devote the time.
Here are some examples of the benefits we have seen. But one caveat. These benefits are from mapping out end to end processes and then using them as the operational manual / training content for end users. This is not a quick flowchart to understand the narrow scope of a problem which is thrown away once the build of an app is started:
Business agility
Investment bank: “If we had had our processes up-to-date when we started the restructure, we could have executed it in half of the time that we did.”
Defence contractor: “Inefficient textual procedures have been replaced with visual processes which played a significant part in winning more than $30 million of new business.”
Food manufacturer: ”It is a way of creating a step change in our ways of working as we look for new and innovative ways of staying ahead“
Construction: “It provided demonstrable corporate governance, improving business performance and pinpointing shortcomings costing more than $25m”
Telecommunications “After the merger we realized that Company X achieved more after six months than Company Y (parent of Company X) had managed after 2 years.”
Removing ambiguity between stakeholders
Oil and gas: “A process model helps articulate and pinpoint shortcomings in ways that are simply not possible when relying on language alone“
Food and drink manufacturer: ”End to end process thinking to break functional silos is absolutely critical for our company to deliver our business model“
Streamlining processes and eliminating waste
Retail bank: ”Our cost per transaction has reduced from €16 to €3, and we have exceeded our target for automatic processing“
Retailer: “We’ve achieved really dramatic improvements in terms of processing time and reduction of outstanding debt.”
Construction engineering: “We’ve identified process improvement savings of $198,000 – per day”
Medical equipment manufacturer: “We achieved an 80% reduction in textual documents and better focus of activities with the added bonus of a 50% reduction in time spent training new recruits.”
Defence contractor: “This has resulted in actual savings of $8 million and further projected savings of $6 million per annum.’
Providing point of need training
Automotive manufacturer: “Speed of access to processes and local procedures was increased by 34 times”
Retailer: “The primary success criteria is mass adoption. Put simply it’s about helping the right people do the right things at the right time.”
Avoiding wasted development effort
OrgConfession #751 “Spent 3 hours putting a change in production after weeks of designing and testing. By the end of the day, we had to turn the new process off again as the whole sales team up in arms about the process that they hadn’t been consulted on.“
OrgConfession #1079 “Spent NINE stressful weeks building an end to end process to automatically route Accounts to Queues, including: A Prospect Rating System for Accounts (which will determine which queue the go to),a custom object to use as the proxy for Accounts, a custom version of Assignment Rules, an Omni-Channel Setup to route said Custom Object according to the Custom Assignment Rules, Batch Apex to get around issues caused by using a scheduled flow, New Process Builder Nodes and 7! New Flows. Only to have the powers that be decide that we’re going to manually assign 10 Accounts to Reps every day for the time being instead of using the Process I spent all that time building.“
Common theme – Universal Process Notation
The common theme across all these examples (apart from the last section of OrgConfessions) is that the customer was committed to driving a process-led approach to understanding their business and documenting it using the Universal Process Notation (UPN). UPN makes it easy to engage all stakeholders and the content can be used as training materials and the basis for continuous improvement. A set of disjointed flowcharts can never achieve that.
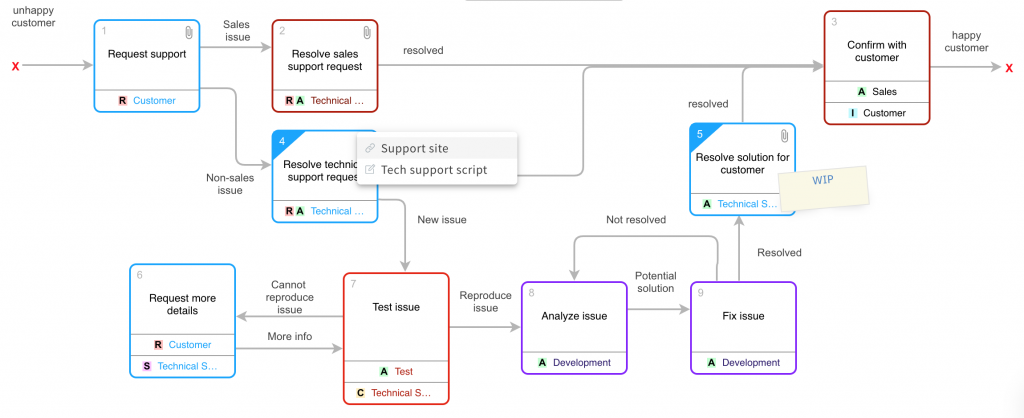
A typical UPN diagram
 .
.
Some subtle but critical aspects of UPN
- A process map is a hierarchy of diagrams; . Drill downs give more detail. This enables each diagrams to be kept to 8–10 boxes, but still describe a broad scope or complex processes. There is no limit to the number of levels you can go down.
- Activity boxes start with verbs; This makes the processes more accurate/specific. Avoid using ‘manage’
- Activity boxes have a ‘resource’ rather than positioned on a swimlane; this enables the diagrams to be tighter with a more logical flow left to right and activity boxes can have multiple resources. Resources are tagged with RASCI (responsible, accountable, consulted, supporting, informed)
- Lines with text exist between every activity box; These are the handoffs between processes and are absolutely fundamental as many process issues are misunderstanding on what the handoff criteria are e.g. what is the shared and agreed definition of “qualified lead” or “closed opportunity”. The lines link between related process diagrams.
- Decisions are several lines coming out of an activity box with line text explaining flow; This reduces the shapes or boxes on a diagram without losing any of the information.
- Attachments show documents/metadata/metrics in context; This reduces the time to find the related and most up to date version of documentation in context.
- Process maps are version controlled, at a diagram level; The process map is the operational definition of the business and it will constantly evolve – but a different cadences. Lower level diagrams typically change more frequently driven byhttps://elements.cloud/2020/06/08/the-evolution-of-process-diagramming-i-e-why-flowcharts-are-so-1980s/ grass roots improvements. Major innovation is driven top down.
Read this article on the difference between flowcharts and UPN