
3 golden rules for getting the Salesforce ROI you deserve
Written by Ian Gotts
Salesforce is an investment. That means it is expensive if you don’t get a great ROI. But there is no reason why it cannot “knock it out of the park” – if your teams follow these 3 golden rules. Each of them has some ideas of the ROI possible from adopting the approach.
- Build the right things first time with rigorous business analysis
- Accelerate changes and reduce risk with visibility of Org impact
- Futureproof development with documentation and analysis
At the bottom of this blog post is a 30 min webinar recording
1. Build the right things right, the first time
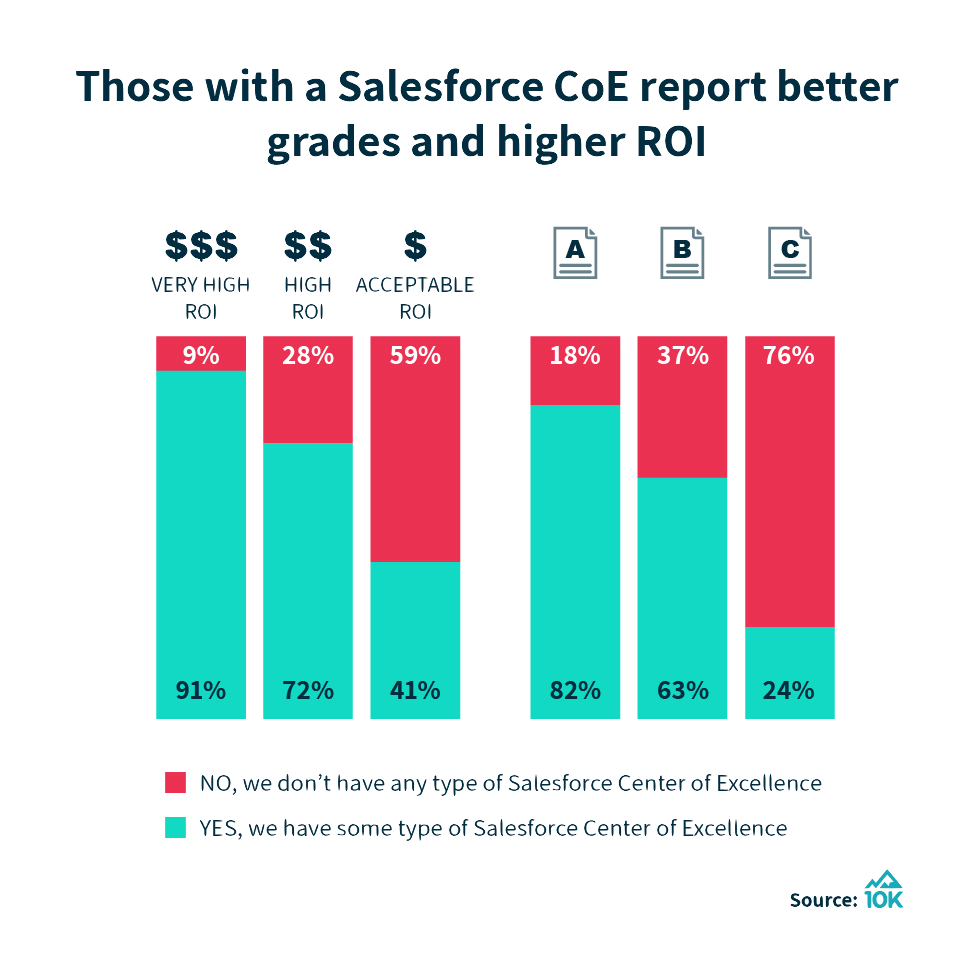
Rigorous business analysis before build will drive out business improvements and validate requirements. It will catch mistakes early and avoid costly rework. 80% of cost savings is done through catching mistakes or misunderstanding of true needs early in Analysis rather than in Production. This is called “Shift Left” because it is spotting the issues earlier (i.e left) in the development cycle.
Benefits
This has several benefits:
- Streamline business operations and identify quick wins
- Eliminate the rework in the build, test, and implementation phases
- Increase adoption by building the apps users need
- Eliminate rework from disconnected and out of sync silos of information (requirements, user stories, process diagrams, apps)
Approach
The approach is a better, more rigorous business analysis. This doesn’t have to take a huge amount of time.
- Building the right thing starts with engagement around analysis:
- What are the real issues and opportunities
- Capture requirements centrally and manage through a lifecycle
- Map business processes to understand true requirements
- Develop user stories with a risk/business value assessment
- Synchronize user stories with Jira to manage development tasks in DevOps
- Salesforce Business process mapping course
- Training on live mapping workshop: https://vimeo.com/491387357
Real benefits
Real-world examples of the benefits are:
Business agility
- Investment bank: “If we had had our processes up-to-date when we started the restructure, we could have executed it in half of the time that we did.”
- Defense contractor: “Inefficient textual procedures have been replaced with visual processes which played a significant part in winning more than $30 million of new business.”
- Construction: “It provided demonstrable corporate governance, improving business performance and pinpointing shortcomings costing more than $25m”
- Telecommunications “After the merger, we realized that Company X achieved more after six months than Company Y (parent of Company X) had managed after 2 years.”
Removing ambiguity between stakeholders
- Oil and gas: “A process model helps articulate and pinpoint shortcomings in ways that are simply not possible when relying on language alone“
- Food manufacturer: ”It is a way of creating a step-change in our ways of working as we look for new and innovative ways of staying ahead“
- Food and drink manufacturer: ”End to end process thinking to break functional silos is absolutely critical for our company to deliver our business model“
Streamlining processes and eliminating waste
- Retail bank: ”Our cost per transaction has reduced from €16 to €3, and we have exceeded our target for automatic processing
- Retailer: “We’ve achieved really dramatic improvements in terms of processing time and reduction of outstanding debt.”
- Construction engineering: “We’ve identified process improvement savings of $198,000 – per day”
- Defense contractor: “This has resulted in actual savings of $8 million and further projected savings of $6 million per annum.’
Providing a point of need training
- Automotive manufacturer: “Speed of access to processes and local procedures was increased by 34 times”
- Retailer: “The primary success criteria is mass adoption. Put simply it’s about helping the right people do the right things at the right time.”
- Medical equipment manufacturer: “We achieved an 80% reduction in textual documents and better focus of activities with the added bonus of a 50% reduction in time spent training new recruits.”
Improved data quality
- Cost of users not understanding apps and entering wrong data
- Calculator : elements.cloud/useradoption
ROI Calculations
Process improvement: Number of users X business benefit
Training: Number of users X salary cost X (hours training month + hours per day looking for answers)
Support calls: Reduced # support calls X average length of call X salary cost
Data quality: Number of users X data entering errors x minutes to fix by support team X salary cost
Wasted development examples and cost calculations
Below are examples of wasted development effort from OrgConfessions.com (anonymous org horror stories)
- Confession #498 – “Client insisted that we split each FSL combo order into separate orders. We ran the job over the weekend and they came on Mon and had 30,000 jobs to separately update and schedule”
- OrgConfession #751 – “Spent 3 hours putting a change in production after weeks of designing and testing. By the end of the day, we had to turn the new process off again as the whole sales team up in arms about the process that they hadn’t been consulted on“
- Confession #798 – “We have over 170 custom apps. Our work seems to be work through them and deprecate the ones we aren’t using, and then 3 months later build them again as a new set of requirements pop back up”
- Confession #923 – “When you spend 2 hours trying to build something for your sales team, to realize they asked for the same thing 2 months ago and it’s already built”
- Confession #1061 – “We have multiple apps with 20 custom objects and automation that have been built that have never EVER been used”
- OrgConfession #1073 – “BIG ORG. Opportunity has 276 Record Types and 140 picklist fields so the grid of assignments is over 5 million records…. And they have 76 Opportunity processes. 275 of the 276 record types are NOT USED. BTW all the other key objects are like this. Lead, Account, Contact, Case”
- OrgConfession #1079 – “Spent NINE stressful weeks building an end-to-end process to automatically route Accounts to Queues, including A Prospect Rating System for Accounts (which will determine which queue the go-to), a custom object to use as the proxy for Accounts, a custom version of Assignment Rules, an Omni-Channel Setup to route said Custom Object according to the Custom Assignment Rules, Batch Apex to get around issues caused by using a scheduled flow, New Process Builder Nodes and 7! New Flows. Only to have the powers that be decide that we’re going to manually assign 10 Accounts to Reps every day for the time being instead of using the Process I spent all that time building.
ROI Calculations
Cost of Salesforce IT defect/rework spend x 80%
Cost of Salesforce IT work on apps never used x 100%
Cost of avg Salesforce license x % users not logged in for the last 3 months
So, look at the development budget
x% of development effort and cost is spent building the wrong things and require rework
x% of development effort and cost is spent building apps that are never used
x% of users never log in
2. Accelerate changes and reduce risk with visibility of Org impact
“Time to value“ means accelerating DevOps. There are clear benefits from faster, more frequent releases.
Visibility of the impact that changes will have on the Org will prevent unexpected problems and release roll-backs. With no visibility, you cannot make good decisions. Either you release slowly as you need to do rigorous analysis, or you release fast hoping that nothing will break.
“You are driving (slowly) in the dark with no lights OR driving fast in the dark with your eyes shut and when you hit stuff, reversing, clearing up the mess and trying again.”
Whilst this could be seen as simply the analysis of the Org metadata it is tightly connected to the business analysis which gives additional context. For example, simply knowing that an Apex Class, Object, or Flow is used by 2 different areas of the business in different processes will stop analysts and developers from making a change that could break an area of the business.
There is a secondary issue. Without visibility it is risky to change or delete metadata items, therefore new/duplicate items are added. This increases tech debt and means analysis gets progressively slower. Future changes are higher risk and higher cost. With better visibility you can reduce technical debt whilst developing new features.
Forrester called this issue the *Salesforce@scale dilemma*
https://elements.cloud/2020/11/05/forrester-five-ways-to-cut-the-risk-of-salesforce/
“Initial success breeds demands for more and more. As additional departments ask for Salesforce subscriptions, business leaders want to expand initial wins with Salesforce CRM into customer and/or partner engagement, marketing automation, and analytics. New custom applications and customizations mushroom. In addition, the complexity of scale crushes Salesforce’s responsiveness. As Salesforce use grows, innovation slows, and flexibility evaporates. Why? Every app change risks breaking one of the hundreds of data and process customizations, integration links, and third-party add-ons. The result: every change requires long and expensive impact-analysis and regression testing projects – killing the responsiveness that made Salesforce attractive at the start.”
Benefits
- Accelerate develops whilst reducing risk
- Reduce the org analysis time for any change
- Understand the impacts of proposed changes and avoid breaking your org and putting operational processes at risk
- Reduce release rollbacks and rework
- Drive down tech debt while you are doing the work
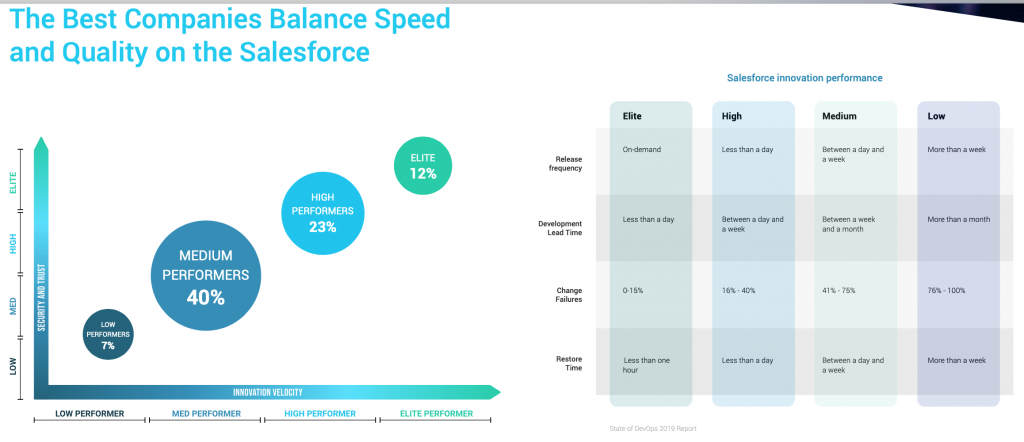
Copado State of DevOps Report
Approach
- Initial Org Analysis – run Org Discovery https://elements.cloud/2020/11/09/org-discovery-process/
- Sync Sandbox and Production Orgs to enable Elements analysis https://vimeo.com/249601674
- Connect process steps and user stories to key Org metadata items https://support.elements.cloud/en/articles/1166123-links-attachments
Examples and cost calculations
Initial Org discovery cut by 50%
CALC: Effort spent on impact analysis x 50%
Analysis of every change cut by 50%
CALC: Effort spent additional analysis time (delay)
The average number of times Salesforce customers break the Org and rollback is 4.57 times per year. How many times for you? Broken Org costs on average $56k each time in lost productivity, rework, and staff costs.
CALC: Number of users x loaded day rate x down time (days) x times per year
worst case 70-100% of releases = 8-12 releases per year, down for 1 week = Users x day rate x 60 days
best case 0-15% of releases = 50 releases per year, down for 1 day = Users x day rate x 7.5 days
With better analysis you can release more frequently, safely i.e release weekly vs monthly – so change implemented 3 weeks faster. Some releases can be fast-tracked safely.
CALC: Number of users X business benefit x additional release cycle time (delay)
3. Futureproof development with documentation
Overview
No-one wants to do documentation. “I will do it later” means it will not happen. But a lack of documentation on WHAT was changed, and more importantly, WHY it was changed increases the risk of changes and adds delay to future releases. It is the primary cause of technical debt. “If I cannot understand what metadata does, I cannot change or delete it, so I replicate it”
This again reinforces the Forrester called this issue the Salesforce@scale dilemma
https://elements.cloud/2020/11/05/forrester-five-ways-to-cut-the-risk-of-salesforce/
Forbes article on the cost of technical debt
https://www.forbes.com/sites/falonfatemi/2016/05/30/technical-debt-the-silent-company-killer/
Approach
There are 4 ways to create documentation:
- Automated (no effort): Elements creates documentation by analyzing the org metadata (which is part of the previous section: Org Analysis).
- Metadata on metadata.
- Field % population.
- Field where used.
- Metadata dependency.
- Optimization recommendations
- 3rd party provided (very limited effort): Elements allows pre-built import from ISV or SI
- Process diagrams
- Documentation of metadata
- In-app help for objects/fields
- Link to existing documentation (limited effort): Linking to metadata items
- Documents on shared drive via URL
- Webpages
- Images
- Apps via URL
- Create new documentation (some effort), so make it as easy as possible where the changes are being made in the moment
- Inside Elements
- Inside Jira via Chrome extension
- Inside Salesforce Setup via Chrome extension
- Inside Salesforce Record Page via Chrome extension
- Inside Copado Setup via Chrome extension
Examples and cost calculation
OrgConfessions.com has 1150+ confessions and poor documentation is one of the top 3 root causes. The typical issues from a lack of documentation are:
- Whilst it’s possible to understand what has been configured in Salesforce it is very difficult to understand how or why and this takes time. So analysis takes longer.
- It is impossible to consider every option, especially if metadata is called by 3rd party apps. So it is putting every change at risk, which means that no changes can be fast-tracked. This slows down release cycles.
- Technical debt gets so great that objects max out fields. The result is an expensive, time-consuming change project to delete fields – putting the org at risk – or upgrading to a higher tier of Salesforce license.
Many of the benefits of documentation reinforce the benefits in the 2 previous areas – Analysis & Visibility, But here are some examples of the challenges of poor/no documentation.
Confession #109: Deleted a field, but only discovered months later when end of year processing integration ran.
Confession #707: I deleted one custom field that blew up 40+ reports, 3 dashboards, and two weeks of my life.
Confession #881: 6 different fields capturing CRM integration info, 5 of them on the same object, all picklists with the same list of values. Oh, and most of them are required fields.
Confession #1101: I worked on a big org that many partners made some sort of development in there and among the dozens of objects, fields, visualforce pages (that are still being developing old and new alike). The most headache I had was that for different record types and layouts, there were fields with the same label that showed for different layouts.
Confession #1140: Went to create 7 new, long text area fields on our Survey object we are working to actually start using. Got an error that the object hit its character limit. There are 50 fields each for Question, Answer, & Comment. Comment fields have 15k+ limits. Not 100% confident in deleting, so just gonna go modify 50 comments fields to only have 5k character limit
Calculations
Analysis of every change cut by 50%
Effort spent additional analysis time (delay)
Average number of times Salesforce customers break the Org and rollback is 4.57 times per year. How many times for you? Broken Org costs on average $56k each time in lost productivity, rework, and staff costs.
Number of users x loaded day rate x down time (days) x times per year
worst case 70-100% of releases = 8-12 releases per year, down for 1 week = Users x day rate x 60 days
best case 0-15% of releases = 50 releases per year, down for 1 day = Users x day rate x 7.5 days
With better analysis you can release more frequently, safely i.e release weekly vs monthly – so change implemented 3 weeks faster. Some releases can be fast-tracked safely.
Number of users X business benefit x additional release cycle time (delay)
Webinar: 3 Golden Rules in 30 Mins
Photo by Dmitry Demidko on Unsplash